Running a Turnout Model
A turnout model simulates the turnout of appliances (based at a set of stations) in response to an appliance request set’s demands.
Output is written to a new table in the database which can then be analysed with analysis tools. ![]() Related Topics
Related Topics
Click  on the toolbar to open the Run Turnout Model window:
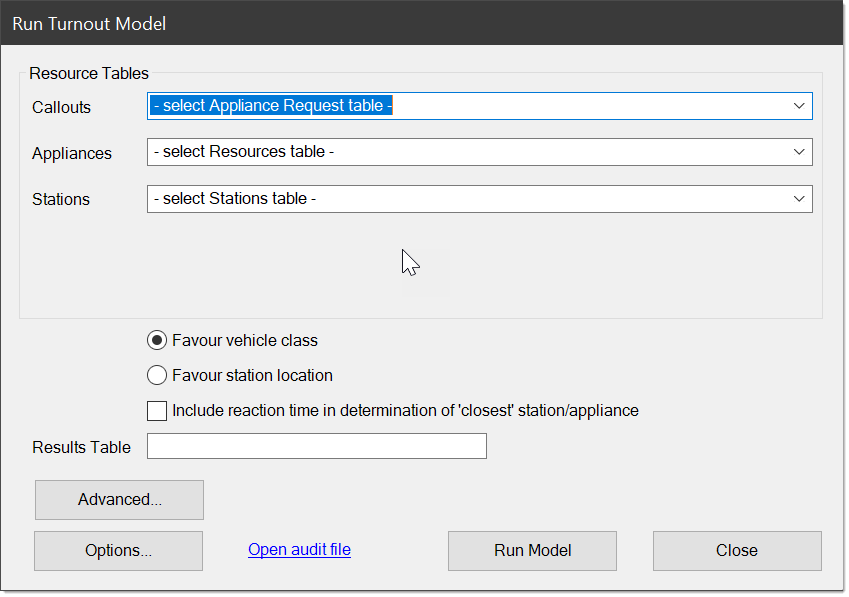
Select the relevant Appliance Request table (Callouts), the Resources table (Appliances) and the Stations table (Stations) from the drop-down lists.
Each of the three drop-down lists shows the table names for the relevant type (and associated comment in brackets.)
Favour vehicle class and Favour station location
This gives the turnout model a bias – either by:
- Vehicle class (where a specific incident demands a certain vehicle class, i.e. a specialised vehicle).
- Proximity (the nearest station location appliance) or
For example in Favour vehicle class, all stations with this particular vehicle class appliance are shown as nearer to the incident irrespective pf physical proximity.
Other stations with different vehicle class appliances may be available closer to the incident but because of Vehicle Class bias, they may be disregarded.
Include reaction time in determination of 'closest' station/appliance
Selects the nearest on the basis of the total route cost + reaction time (+ staff system).
For example in an incident X where
- Station A is 5 minutes away and appliance at A has a reaction time of 3 minutes
- Station B is 6 minutes away and appliance at B has a reaction time of 1 minute
If reaction time is not specified, the appliance at A is assigned to X. However if reaction time is enabled as a choice, the appliance at B is assigned to X.
Consider the following scenarios:
- With Include reaction time selected: If an appliance is prioritised to Fires within 10 minutes but the appliance has a reaction time of 2 minutes, the prioritisation will only be applied if the travel time was 8 minutes or less.
- Without Include reaction time selected: If an appliance is prioritised to Fires within 10 minutes and the appliance has a reaction time of 2 minutes, the prioritisation will still consider fires up to 10 minutes travel away. This means it can assign an appliance which will actually be in attendance within 12 minutes.
Note: This option is available for Turnout models only, i.e. not for Predict models.
The set up for this model is very similar to Predict Demand in Setting up the prediction model. The differences are:
- Output is sent to a table in the database rather than Excel;
- There is no option to seed appliances.
Options
Click Optionsfor further modelling options. ![]() Related Topics
Related Topics
Advanced
"Stop model after incident" : Use this option to define a stop point in the data. For example if you specify an incident number in the value field, the model will stop after this particular incident has been processed.
"Log appliance status for incident callouts" The option to log to the audit file the status of all appliances at the time of callout for the incidents listed.
Open Audit File
Workload Modeller Add-in creates an audit file every time it is launched; use this file to as a log to determine all errors found during data load. ![]() Related Topics
Related Topics
Run model
The model generates a set of output the structure of which is compatible with Callouts in the Historic Data.
This means the simulated turnouts can be analysed exactly like Historic Data for performance to be assessed.
How the model works
Run Model takes the Appliance Requests in the selected set and processes these one by one chronologically.
For each request in this hour slot – in time order –
-
Determines which vehicle class(es) can respond to the request on the basis of incident type.
- Is there an appliance available at time of request-assignment at the station nearest to the incident?
- If YES, then mark the appliance as busy until the request release time and get next request
- If NO then is there an appliance free at a neighbouring station?
- If YES then mark the appliance as busy until the request release time and get next request
- If NO , see if our initial station has capacity for another vehicle (if we have one from the unallocated pool)
- If a vehicle can be placed at this station then do so and mark it as busy until the release time
- If no then see if another vehicle can be placed at a near station
- If yes then place a vehicle at the near station and mark it as busy until the release time
- If No, then go back to step 2 for the next vehicle class determined in step 1. If there are no more vehicle classes to try then the model will ‘wait’ for the first appliance to become free and that is assigned. These delays will be apparent in the analysis tools, i.e. attendance performance will suffer.
Then for a vehicle class:
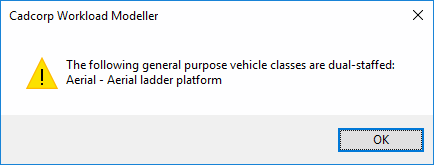
If an appliance request cannot be satisfied, i.e. no suitable appliances are available, the model will ‘wait’ for the first general purpose appliance to become available and despatch that.
A warning will be displayed if the modelling finds that a general purpose vehicle class has been set up as being dual-staffed:
No views are created by Run Model. Appliance Request Sets can be displayed directly as View Points overlays in Map Modeller.
Run Model does not perform any appliance ‘seeding’ either.
Appliances which have not had their locations defined in advance in the Resource Set will be deployed to stations as they are needed.
This deployment is ‘static’, i.e. an appliance will remain allocated to the station to which it is assigned.
Turnout model details
When running a turnout model, first determine which callouts, appliances and stations sets should be used. These are the primary inputs.
Recalling Key Inputs
To recall key inputs used for a model (maybe at a later date) use the tblTurnoutModels table.
This is a table which records the key input sets that were selected when a model is run. tblTurnoutModels stores the following for each turnout model:
- tblMO_table – the main table for the model’s output;
- tblRST_table – the table of resources (appliances) used in the model;
- tblSST_table – the table of stations used in the model;
- tblART_table – the table of appliance requests (callouts) used in the model
- RouteCostDatabase – the route cost database used in the model
- Caclulated – the date and time the calculation completed
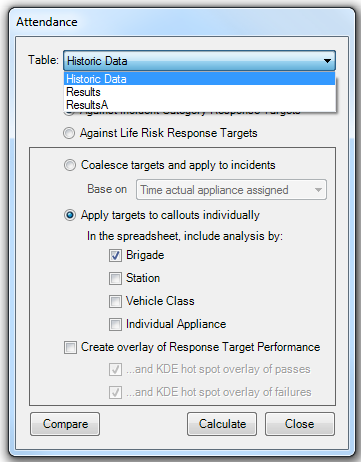
Use the drop-down menus to pick the ‘tables’ for The Incidents, Attendance and Utilisation commands to be analysed.
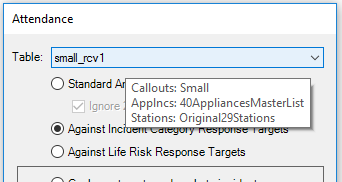
Note: If the ‘table’ selected has had its key inputs recorded, these are displayed in a tooltip.
The following screen shot shows key inputs of selected model on the Attendance screen.
If a model’s key inputs have been recorded, these will also be output in the title sheet of an analysis workbook.
This can be seen as lines 7 - 11 in the example below.
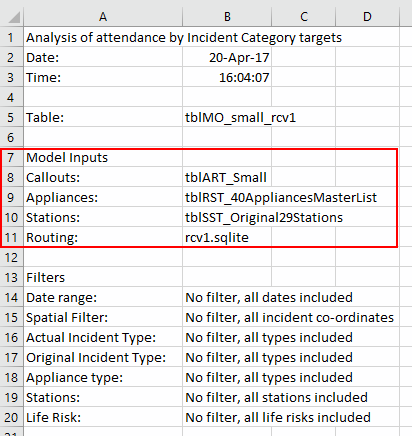
The Model's key inputs are written to the Title worksheet in all analysis workbooks.
Similarly, Workbook comparison will collate this information in the title sheet of the comparison workbook. This can be seen in lines 9 - 11 in the example below.
The internal table names are 'translated' to the names seen in the Workload Modeller interface. For example, ‘tblMO_small_rcv1’ in the analysis workbook is shown as ‘small_rcv1’ in the comparison workbook:
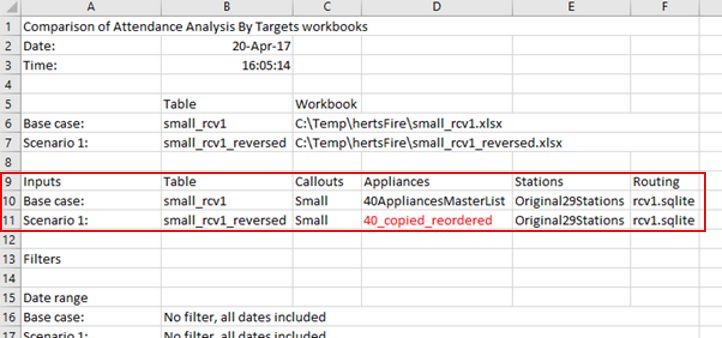
Models' key inputs collated in the Comparison title worksheet
Compare
To compare a base case with a particular scenario click Compare.
The Compare Workload Modeller Workbooks dialog will be displayed:
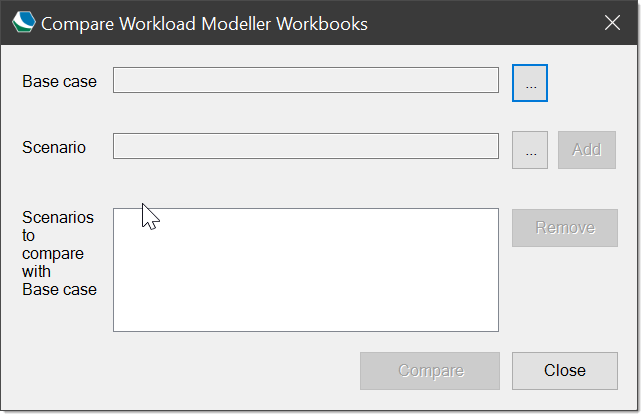
Click the Base case ... button to navigate to the Base case workbook.
Click the Scenario ... button to navigate to the Scenario workbook.
The descriptions of each selection will be displayed. Click Add to accept the Scenario.
Click Compare.
Navigate to the location to save the output file.